Visual Debugging Tools for Machine Learning Workflows – KDnuggets
3 min read
Certainly, training machine learning models can be tricky. They might stop improving or behave strangely, and it is hard to know why. Furthermore, seeing inside the training process is key to fixing these problems.
Moreover, visual debugging tools help with this. They let you see important things like loss curves, gradients, and embeddings. Consequently, you can spot issues like overfitting or vanishing gradients early.
Additionally, tools like TensorBoard and Weights & Biases make this easier. They provide dashboards to track your experiments. Likewise, using debugging hooks in your code lets you inspect data directly during a run.
| Tool | Key Features | Best For |
|---|---|---|
| TensorBoard | Scalars, histograms, images, embedding projector; works with PyTorch via torch.utils.tensorboard; local or TensorBoard.dev hosting | Individual developers who need a quick, built-in starting point for training visualization without setup overhead |
| Weights & Biases (W&B) | Cloud-synced dashboards, automatic system-metric logging (GPU, memory), hyperparameter sweeps with built-in visualization, shared team workspaces | Collaborative ML teams running many parallel experiments who need seamless experiment comparison and reproducibility |
| Sacred + Omniboard | Decorator-based config capture, full runtime-change logging, MongoDB-backed permanent run records; requires separate front-end (Omniboard/Sacredboard) | Teams prioritizing strict reproducibility and auditable experiment histories over rich built-in visualizations |
| Guild.ai | CLI-driven — no code changes required; auto-records logs and output files linked to runs; local UI and CLI for metric comparison | Developers working with existing or third-party scripts who want minimal setup and prefer command-line workflows |
| PyTorch Hooks & Debuggers | register_forward_hook / register_backward_hook for per-layer tensor inspection; pdb or IDE breakpoints for interactive stepping; NaN detection | Low-level debugging of gradient flow, numerical instability, and intermediate activations during the first few training batches |
Visual Debugging Tools for ML
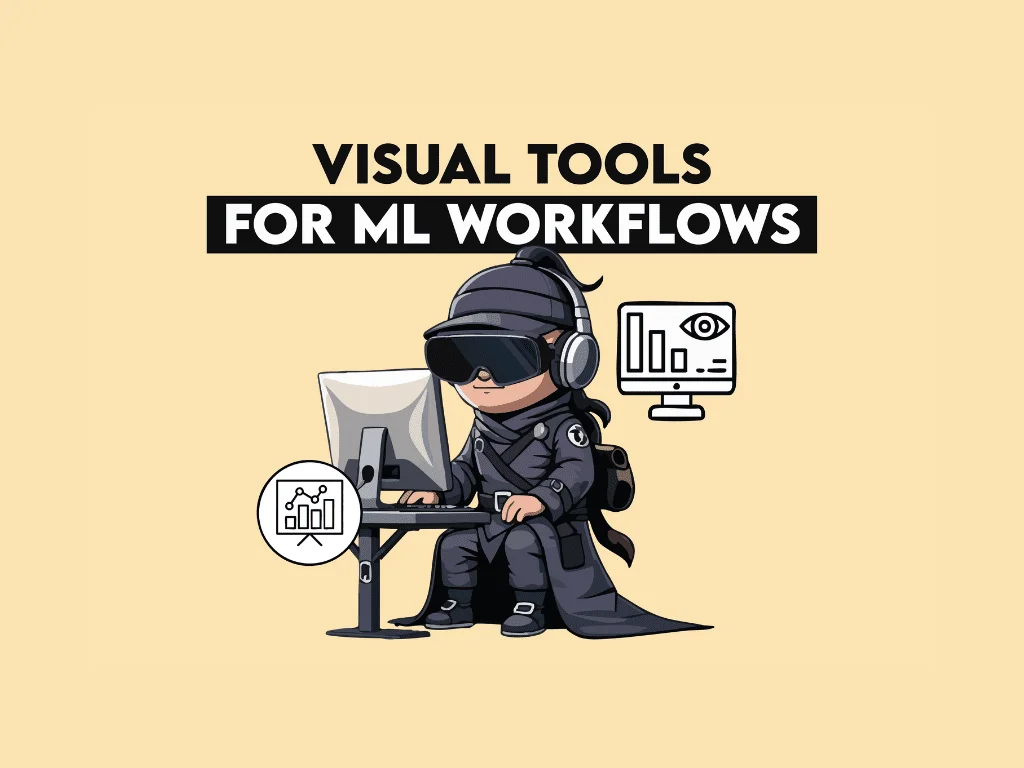
Visual debugging tools help everyone understand why their machine learning model fails during training. Moreover, tools like TensorBoard and Weights & Biases let people see loss curves and gradient patterns clearly. Specifically, vanishing gradients and overfitting become visible before they ruin a model. Furthermore, hooks and breakpoints let them inspect tensors directly inside each layer. As a result, these tools shorten the time between a problem and its fix.
Accelerated Model Diagnostics
This indicates that gradients shrink significantly as they travel from the output layer back to the input layer. Therefore, early layers receive very small learning signals. Moreover, the output layer’s gradient is roughly 20 times larger than the first layer’s. Consequently, initial layers may undertrain silently without anyone noticing. In contrast, a healthy network would show more even gradient values across all layers.
“What these tools do is shorten the distance between something going wrong and understanding why — which is usually most of the work.”
Ultimately, visual debugging helps us understand what happens during model training. In conclusion, tools that show loss curves and gradients let us spot problems early. Looking ahead, platforms like TensorBoard make experiments easier to track. As a result, teams can collaborate and share findings easily. Therefore, we can build more reliable AI together. Thus, using hooks gives us deep insight into our models. Hence, debugging becomes faster and more intuitive. In summary, these tools empower everyone to create better technology. To conclude, clear visualization is key to model success. Finally, this leads to smarter, fairer systems for all.
Ultimately, visual debugging tools give us a direct view into model training, helping to find issues like overfitting or vanishing gradients. Consequently, moving beyond simple loss metrics allows for more proactive and informed problem-solving. Accordingly, a range of tools from TensorBoard to specialized platforms exist to support this crucial visibility.
Thus, choosing the right tool depends on team needs for collaboration, reproducibility, or minimal setup. Therefore, these methods significantly shorten the time between a problem occurring and understanding its cause. In summary, embracing visual debugging is a key step toward more reliable and efficient machine learning development for everyone.